Part 1
- 假設台灣大學資訊系在2001、2002及2003年的人員組成如下表所示:
類別 大一 大二 大三 大四 碩一 碩二 博士班 教職員 年份 2001 10 21 23 14 35 26 47 48 2002 21 32 33 24 35 26 17 48 2003 15 23 23 44 25 34 27 38 - 請用 bar3 指令來畫出上述資料的立體長條圖。
- 請用各種你可以想到的方法,在上述圖形中加入各種解釋和說明的文字。
- 請使用上題的資料來進行下列兩小題:
- 畫出依每年份總人數來切分的立體扇形圖,並加上各種可能的說明文字。
- 重覆上小題,但改成依每種類別的總人數來切分。
- 畫出下列方程式的曲面圖及等高線圖:
$$
z=sin(x/2)cos(y)
$$
其中,x 的 21 個值均勻分佈在 [-2*pi, 2*pi] 範圍,y 的 31 值均勻分佈在 [-1.5*pi, 1.5*pi]。請使用 subplot(1,2,1) 和 subplot(1,2,2) 將產生的曲面圖和等高線圖秀在同一個視窗上,產生的圖形應類似下圖:
- 請用 meshc 指令來同時畫出下列函數的曲面圖和等高線圖: $$ z=\frac{xy}{x+y} $$ 其中 x 和 y 都介於 0 和 1 中間,且各自都分成 21 個格子點,所以此曲面共有 21*21=441 個點。此外,等高線圖應有 20 條。請問此曲面在 XY 平面的哪一點(或區域)會有最大值?此最大值為何?
- 請畫出下列圓椎曲面的三度空間曲面圖及其10條等高線:
- $z=xy$
- $z=x^2+2xy+y^2$
- $z=x^2+2xy+2y^2$
- $z=x^2-2xy-y^2$
- 假設有一圓球半徑為1,圓心在 (0,0,0),試畫出此圓球的上半部網狀圖,並將其30條等高線同時畫在曲面的下方。
- 使用 contour 指令畫出下列隱函數的圖形:
$$
x^2+y^2=25
$$
- 請寫一段程式碼來完成下列繪圖(在進行下列兩項作業時,請顯示複數平面座標):
- 參考本章的範例,畫出 $f(z) = |z^4-1|$ 在極座標上的等高線圖。
- 請同時畫出上述函數的曲面圖和等高線圖。
Part 2
- Theorem on gradients and contour curves: Consider any point (x0,y0), and the contour curve of f through this point (i.e., the contour curve of f at value f(x0,y0)). Prove that the gradient of f at f(x0,y0) is perpendicular to the tangent direction along the contour curve of f though (x0,y0).
- Parameter for constructing a crown:
Suppose that we have a MATLAB script to generate the crown:
theta = -pi:0.05:pi; x = cos(theta); y = sin(theta); z = abs(cos(n*theta)).*exp(-abs(theta/4)); stem3(x, y, z, 'fill'); What is the most likely value of n in order to generate the following crown?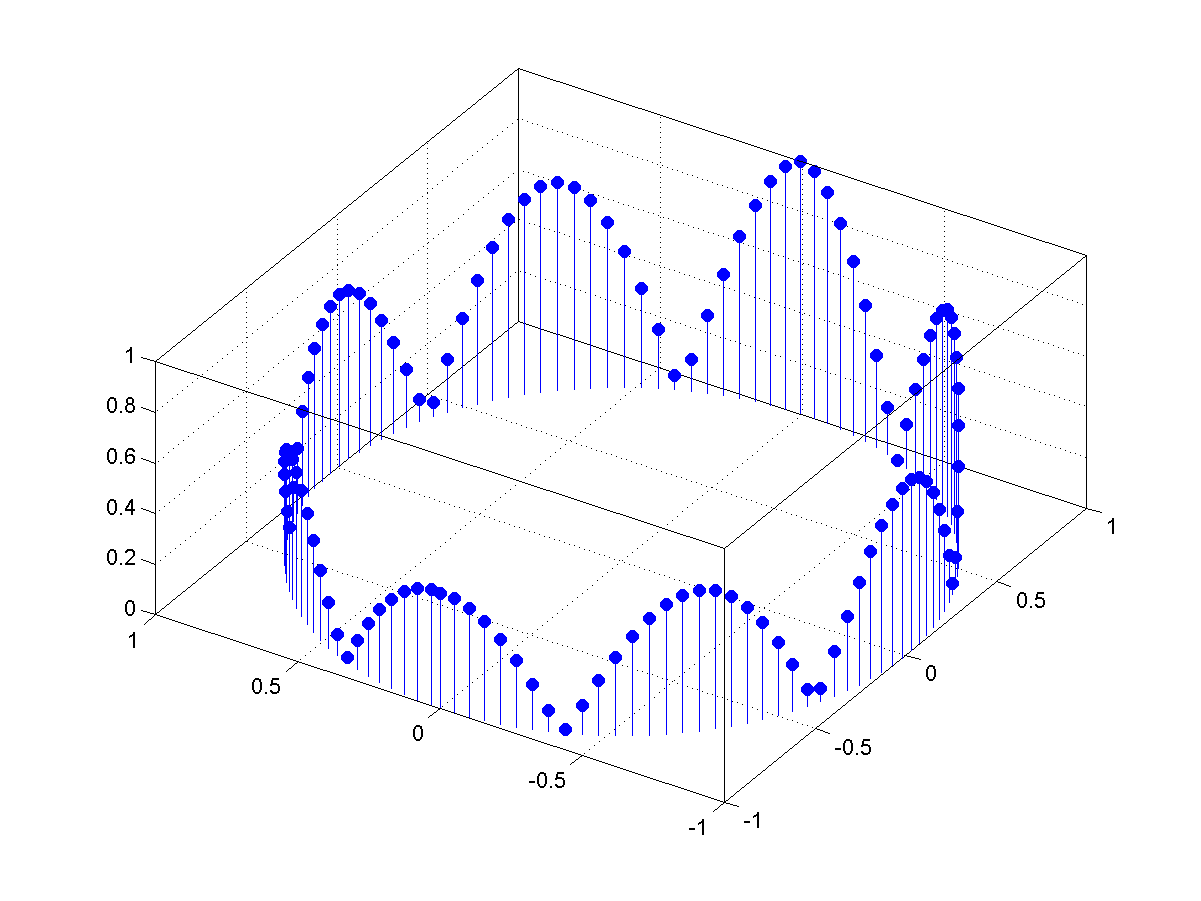
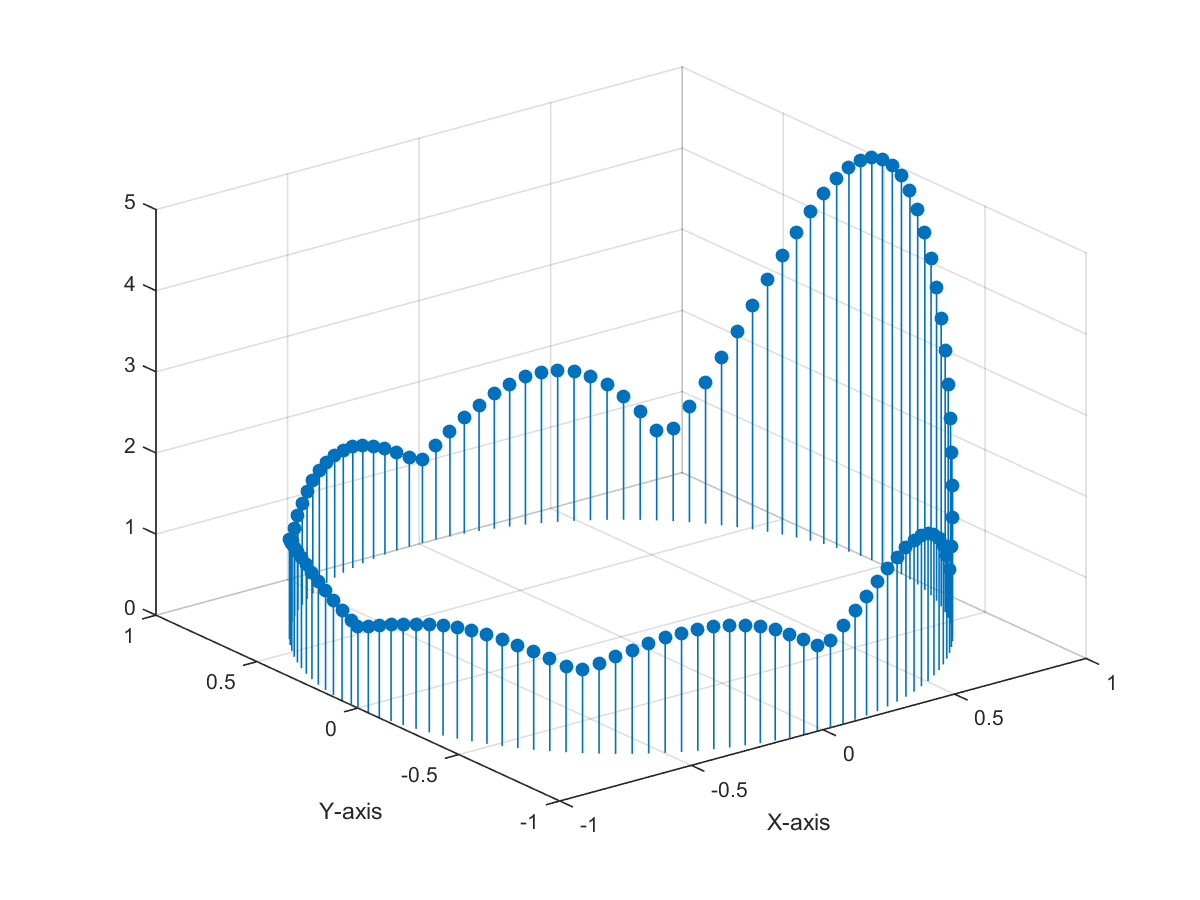
- Construct a crown:
Write a MATLAB script to construct a crown as close as possible to the following plot:

- Construct yet another crown:
- Plot the function sin(x)/x over the interval [-pi, pi].
- Plot the function of |sin(x)/x| over the interval [-pi, pi].
- Write a MATLAB script to construct a crown as close as possible to the following plot:
- Interpolation of indexed color:
Suppose that we have a MATLAB script to genrate a rectangle of varying color:
X = [0 0 1 1]; Y = [0 1 1 0]; Z = [0 1 1 0]; C = [0 0.3 0.6 0.9]; fill3(X, Y, Z, C); colorbar;
What is the color value (in terms of the colormap) at x=2/3 and y=1/2?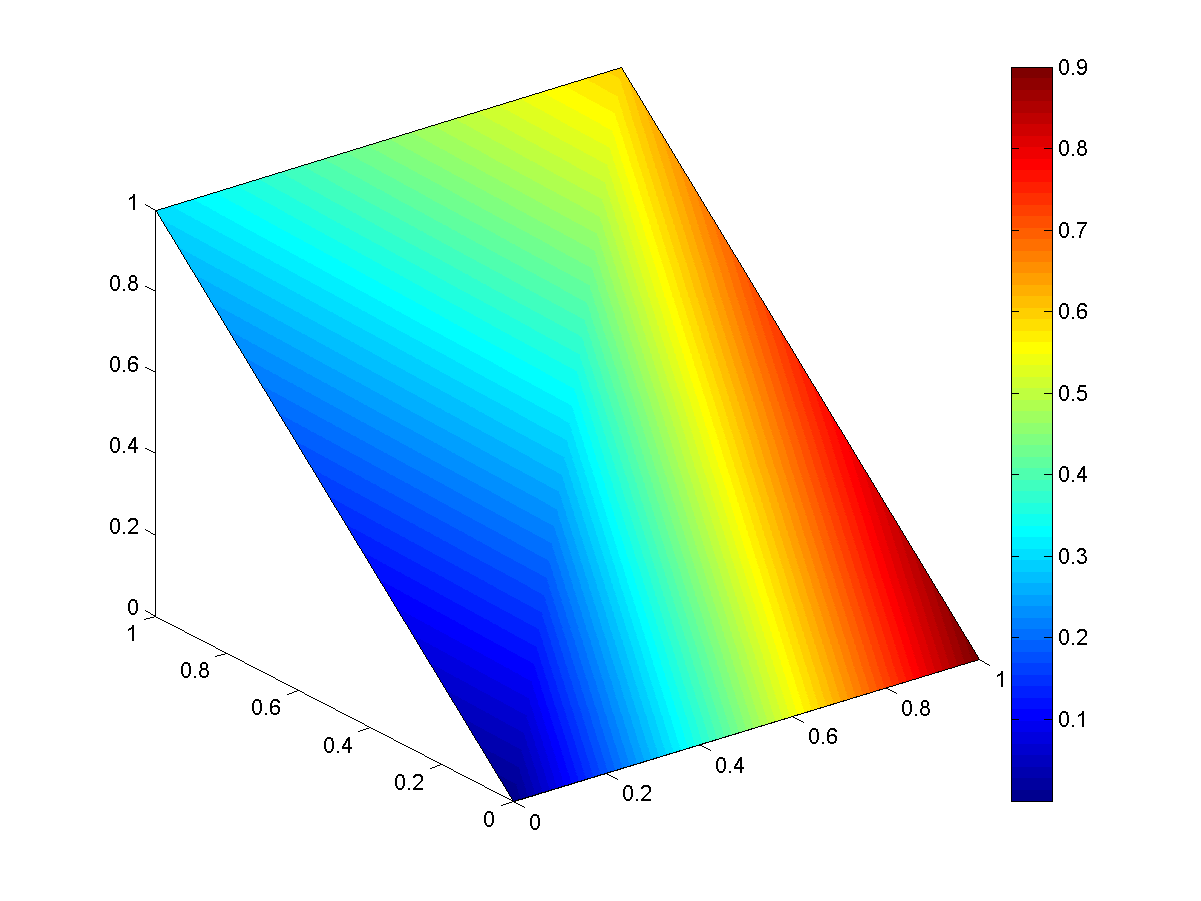
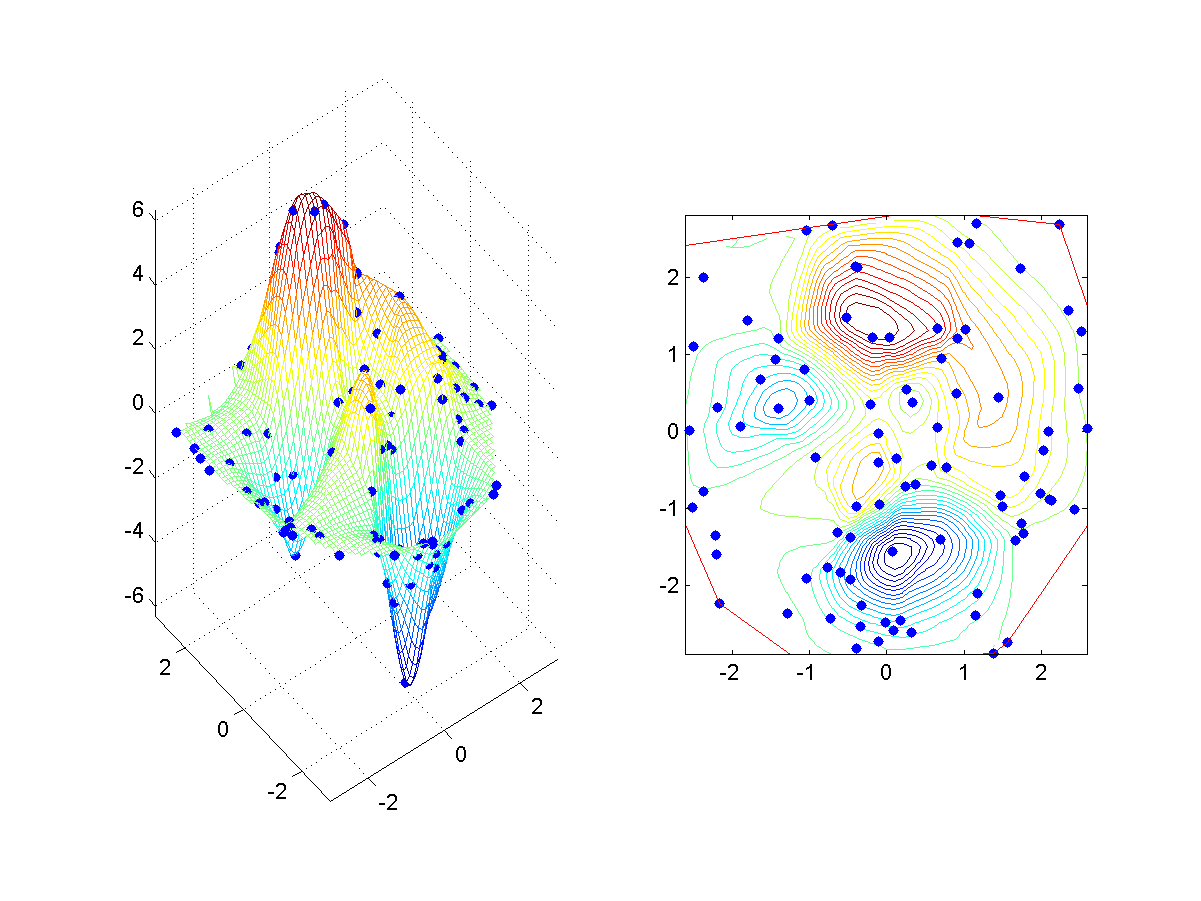
- Scatter data plot and its contours:
請跟據課本範例4─12的曲面,來同時畫出曲面圖及等高線圖:
- 請畫出此曲面的等高線圖。
- 請在等高線圖上面畫出每一個資料點。
- 請疊加畫出這些資料點的 convex hull。(提示:請參考指令 convhull。)
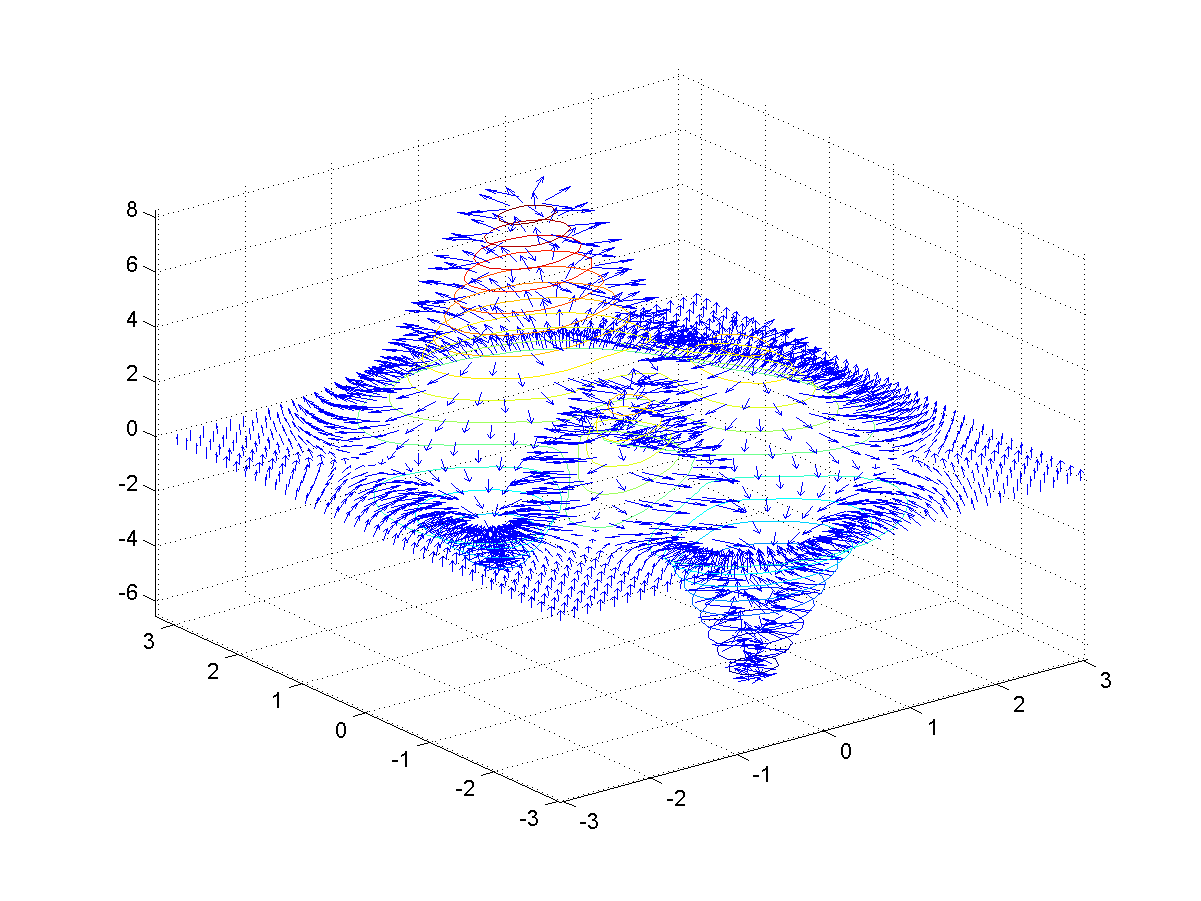
- Multiple plots of peaks function:
請跟據 peaks 來進行下列作圖:
- 請畫出此曲面,曲面矩陣維度是 40x40。
- 加入三度空間的 30 條等高線。
- 再加入三度空間的 surface norm vectors。
MATLAB程式設計:入門篇
